
What barometric pressure causes migraines? The evidence
No single pressure reading has been shown to trigger migraine. What studies found about pressure drops, in hPa, inHg and kPa, and how to check your own diary.
The short answer
No single barometric pressure reading has been shown to cause migraine. Where studies found a link, it was with changes, mostly falls. In a year-long diary study in Japan, for example, migraine was more frequent when pressure fell by more than 5 hPa (about 0.15 inHg) between the day of the headache and the next day.
The effects are small and the results are mixed. Larger studies found small effects or none, and many people believe the weather affects them more than their diaries show. Your own records are the best way to check whether pressure matters for you.
Why there is no single number
Weather apps show pressure adjusted to sea level. Apple’s WeatherKit, which supplies Apple Weather and Migraine Tracker, describes its reading as “the sea level air pressure in millibars”. The pressure actually around you depends on your altitude. The US National Weather Service notes that places near 1,500 metres (5,000 feet) “normally have pressures on the order of 24 inches of mercury”, about 813 hPa, far below the 1013 hPa often quoted for sea level.
So the number on your screen is a standardised value for comparing weather systems, not the pressure your body is exposed to. What you can compare from day to day is the change.
Those changes are small. The Weather Service’s rule of thumb is that pressure drops about 1 inch of mercury for every 1,000 feet you climb. By that rule, a 5 hPa fall in the weather is about the same change in pressure as going up 45 metres (150 feet). How a change that small could contribute to an attack has not been established. In the year-long Japanese study described below, the pressure level itself showed no link with migraine.
What the studies found
Researchers have used paper diaries, smartphone apps and hospital records. They have also measured pressure over different windows: hours before a headache, the day before, the day after. That is part of the reason their results differ.
| Study and participants | What it found |
|---|---|
| Kimoto et al., 2011, Japan28 people with migraine, diaries for a year | More migraine when pressure fell by more than 5 hPa from the headache day to the next day, but only in the 18 who described themselves as weather-sensitive. Changes before the headache day showed no link. |
| Okuma et al., 2015, Japan34 people with migraine, diaries for about three weeks as a typhoon passed | Attacks were most frequent at readings 6–10 hPa below the standard 1013 hPa. |
| Katsuki et al., 2023, Japan4,375 users of a headache diary app | Pressure had fallen in the 6 hours before headaches. The study included all types of headache. |
| Portt et al., 2026, Canada7,418 users of a migraine app in Ontario, with 69,808 attacks | Attacks were slightly more likely on days with a 24-hour fall of 10–20 hPa, and on days with a rise of 20 hPa or more. |
| Prince et al., 2004, USA77 people with migraine from a headache clinic | 48 believed weather affected their headaches. The analysis found weather sensitivity in 39, and a response to barometric pressure in 10. |
| Zebenholzer et al., 2011, Austria238 people with migraine, diaries for 90 days | No link with weather remained significant after correcting for multiple testing. How people perceived the weather did not match when their attacks occurred. |
| Mukamal et al., 2009, USA7,054 emergency visits for headache | Higher temperatures in the previous 24 hours were linked to more headache visits, with and without migraine. Lower pressure 48 to 72 hours before was linked only to headaches other than migraine. |
A 2025 review of 14 studies with 2,696 participants summed up the evidence: “Some evidence suggests a link between barometric pressure drops or fluctuations and increased migraine frequency. However, associations with migraine severity remain unclear, and no evidence supports a relationship with attack duration.” The reviewers noted that many of the studies were small, short and based on self-reported diaries.
Two findings matter most if you want to check your own records. The effects in large studies are small: in the Ontario study, the links it found with weather and air pollution raised the odds of an attack by between 2% and 9%. And people often believe weather affects them more than their records show, as the clinic study above found.
Pressure in your units
Studies and weather apps use different units. Here are the numbers from this post side by side.
| hPa (mbar) | inHg | kPa | mmHg | |
|---|---|---|---|---|
| Standard sea-level pressure | 1013.25 | 29.92 | 101.3 | 760 |
| A fall of 5 hPa | 5 | 0.15 | 0.5 | 3.75 |
| A fall of 10 hPa | 10 | 0.30 | 1.0 | 7.5 |
| 6–10 hPa below standard | 1003–1007 | 29.62–29.74 | 100.3–100.7 | 752–755 |
Conversions use the NIST factors: 1 hPa is 1 millibar, 0.1 kPa, 0.02953 inHg or 0.7501 mmHg. NOAA gives standard sea-level pressure as 1013.25 hPa, or 29.92 inches of mercury.
Check your own diary
The studies cannot tell you whether pressure matters for you, and a hunch is not a reliable guide. In a 2022 study, 328 people with migraine tracked their attacks and suspected triggers in an app for 90 days. Commonly suspected triggers, including barometric pressure, were statistically linked to attacks in fewer than a third of the people who suspected each one. Your records can show which group you are in, if you look at them carefully.
- Record attacks when they start. Migraine Tracker saves pressure only for attacks started in real time, so an attack you add later has no reading.
- Keep going through different weather. A few weeks of settled weather cannot show a pattern. Aim for at least two or three months.
- Count the attacks that started after a fall. For each attack, look at the change over the previous 24 hours and count how many followed a fall of 5 hPa or more. Studies have used other windows too, from 6 hours before an attack to the day after, so a weather history for your area can show what happened next.
- Compare with how often falls happen anyway. Changes of this size are common. In the Ontario study, 24-hour changes ranged from a fall of 46 hPa to a rise of 47 hPa, and the middle half of all days fell within a band of 9.4 hPa. Use a weather service’s history for your area to count the days with a fall as large as the one you are checking. If such falls are common, several attacks after a fall can happen by chance.
- Look for other explanations. A stormy spell can also bring a temperature change, a bad night’s sleep or a cancelled plan. A pattern in a diary is a starting point, not proof of a cause.
Here is a fictional example. Over three months you logged 12 attacks, and 5 of them started after a fall of 5 hPa or more. The weather history shows falls that large on 20 of the 90 days, about one day in five. By chance alone, you would expect around 3 of your 12 attacks to follow such a fall. Five is more than that, but with numbers this small, chance can easily explain the difference. It is a reason to keep recording and to mention it to your clinician, not a conclusion.
What Migraine Tracker records
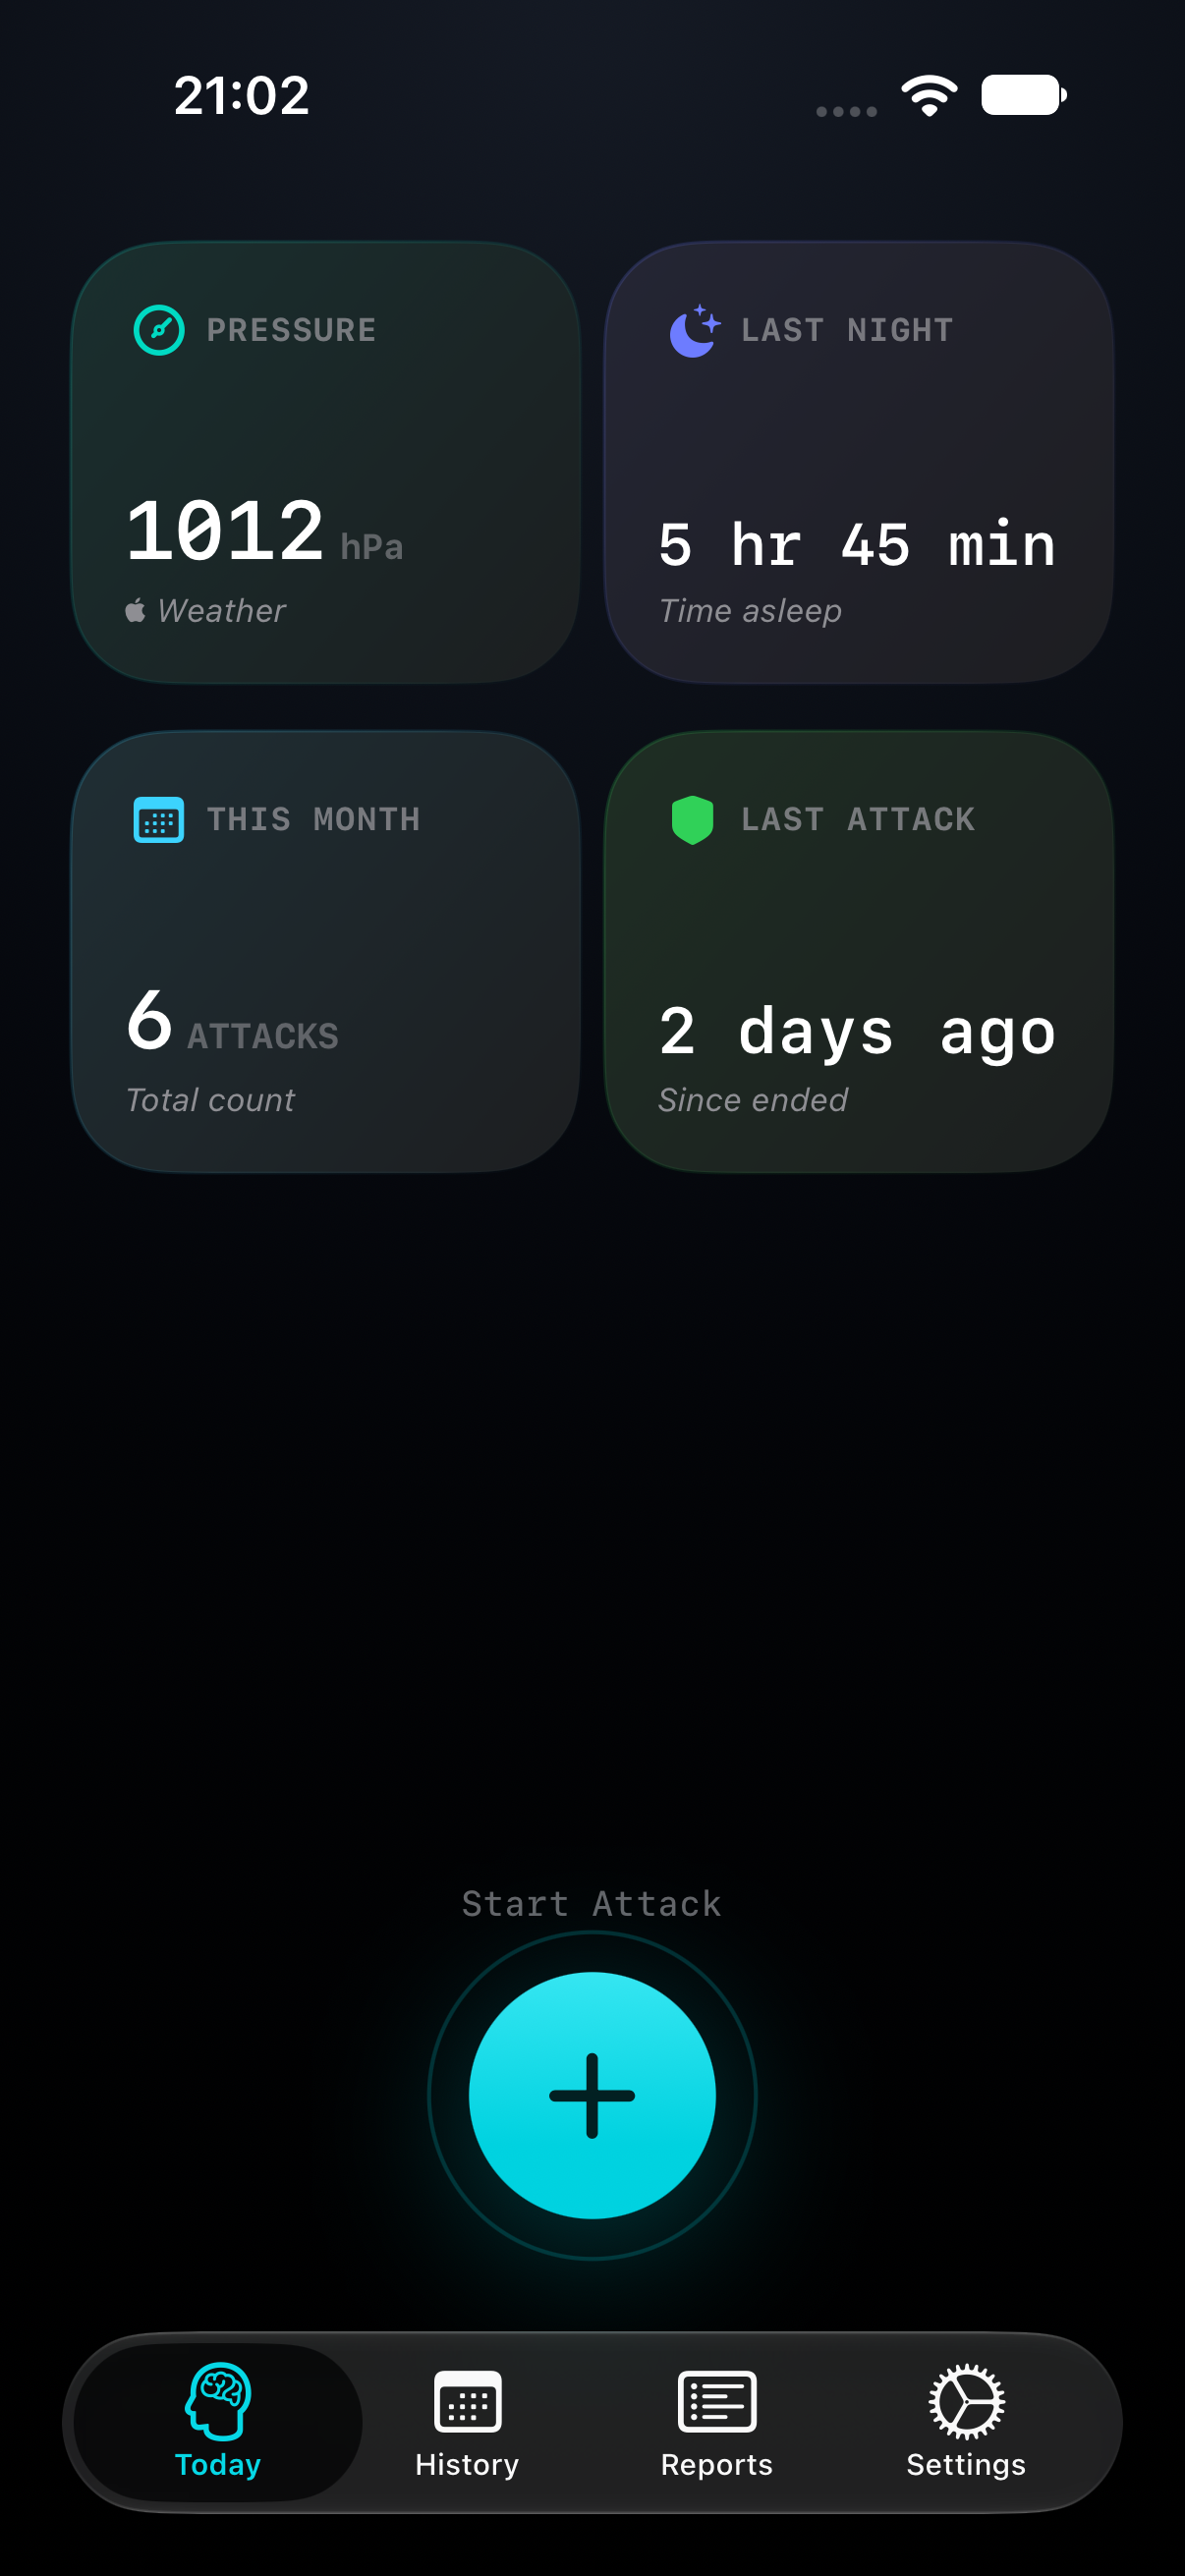
- Current pressure. With location access, the Today screen shows the current pressure from Apple Weather.
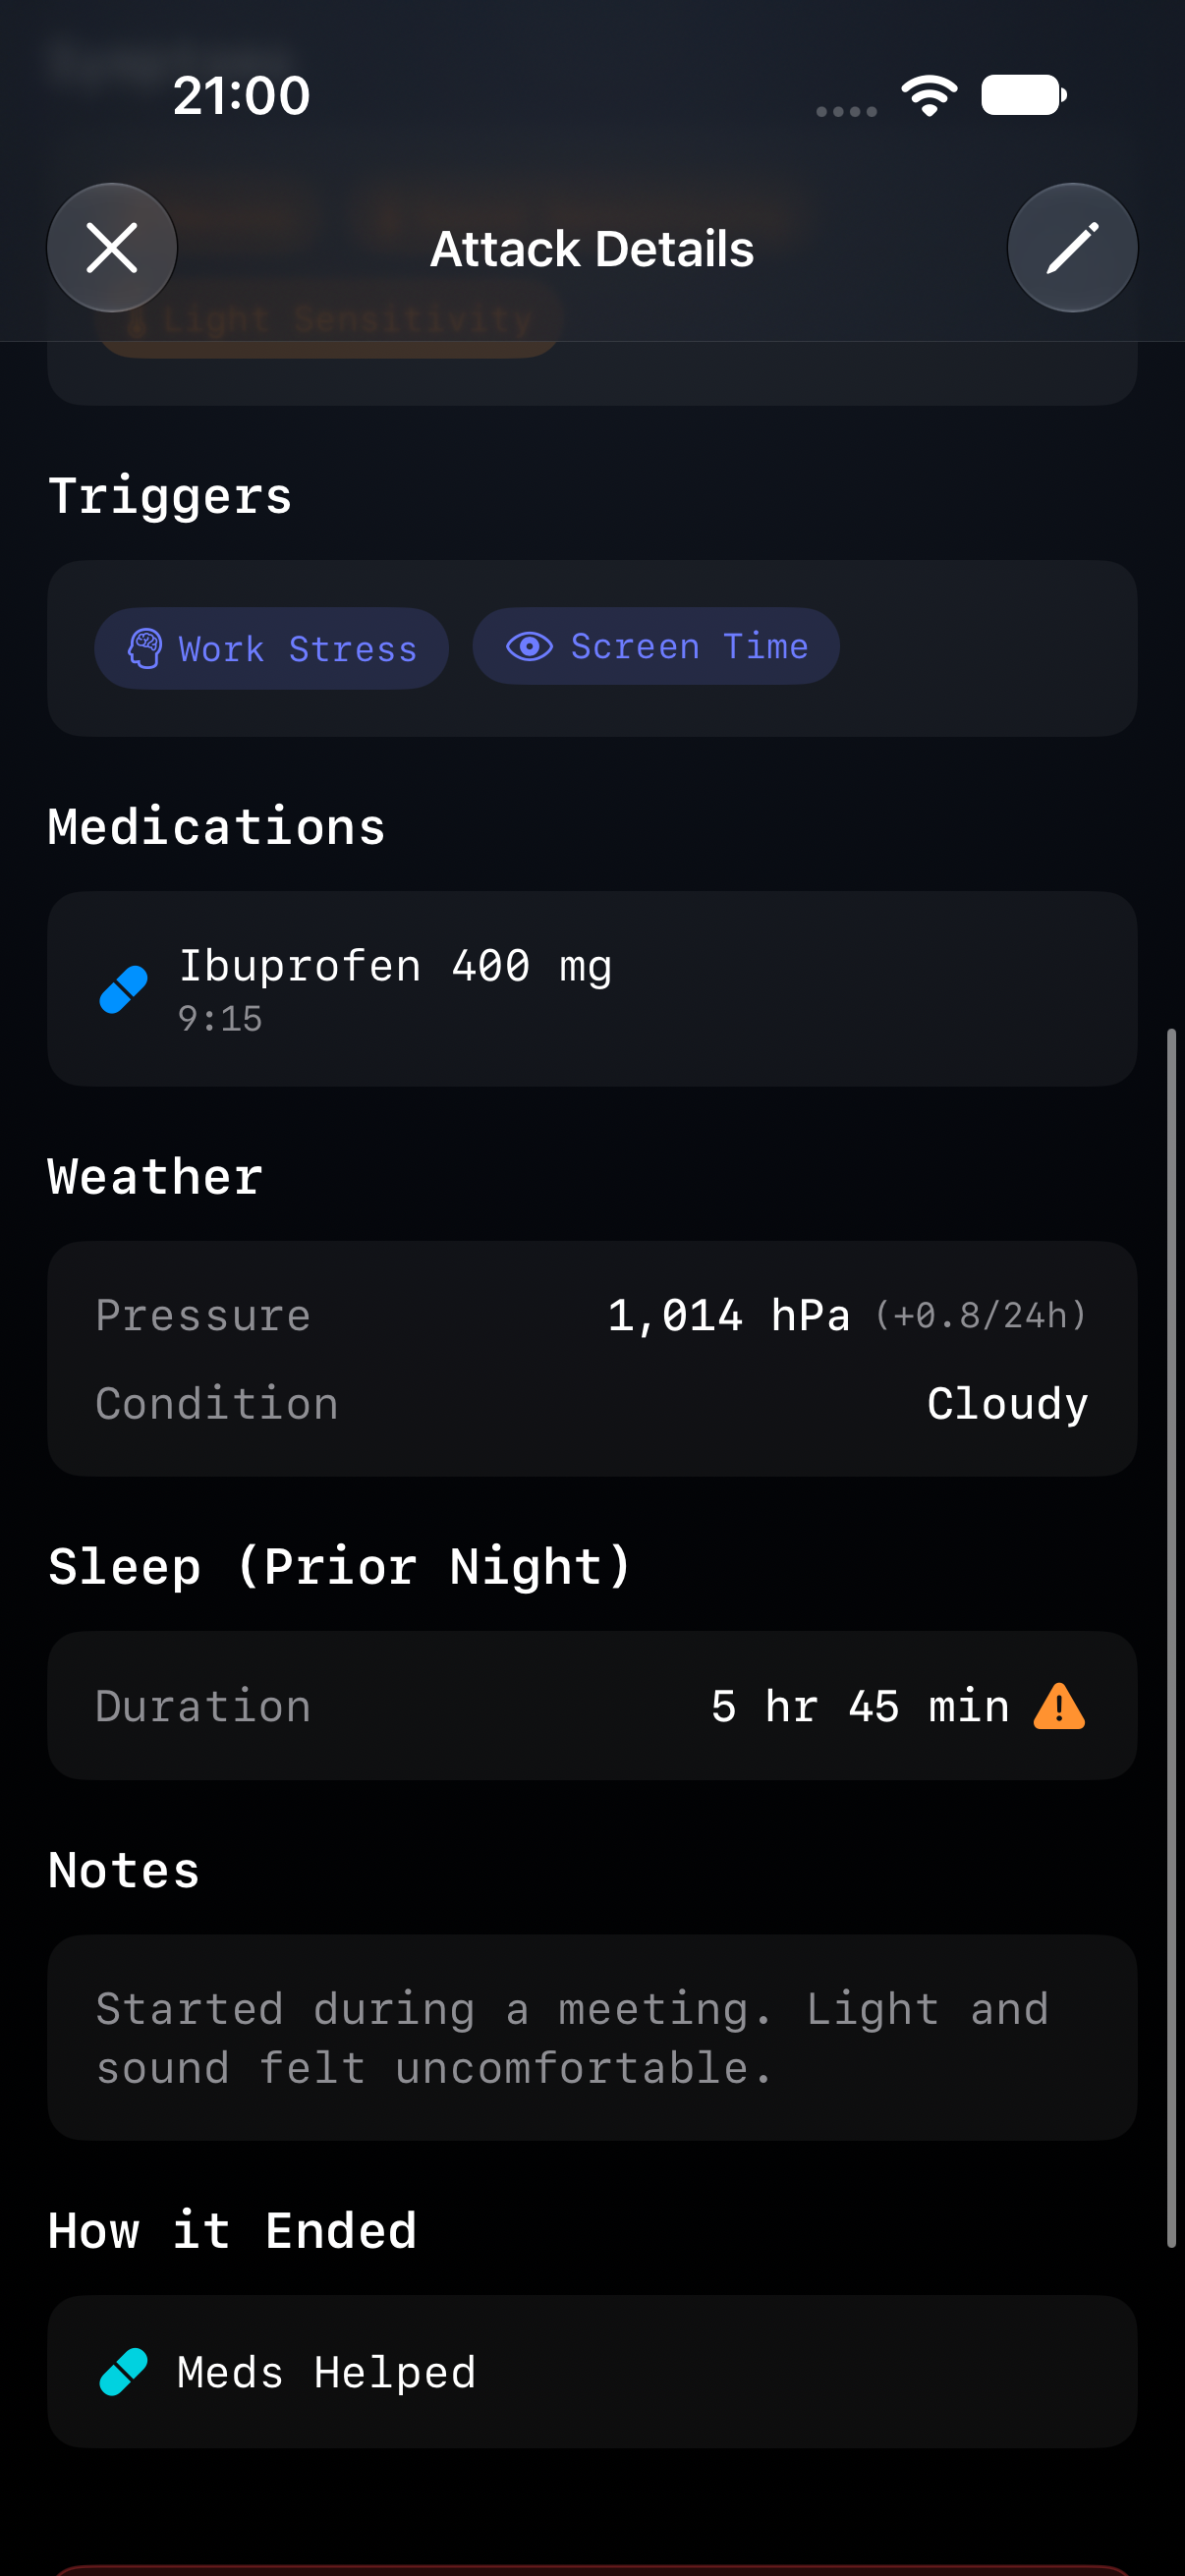
- Pressure when an attack starts. When you start an attack in the app, on Apple Watch or with Siri, Migraine Tracker saves the pressure and its change from the reading closest to 24 hours earlier. If there is no reading from about a day before, the change is left blank.
- Attacks you add later have no reading. The app records pressure only for attacks started in real time.
- A forecast fall. If tomorrow’s lowest forecast pressure is more than 5 hPa below the current reading, the Today screen shows a Barometric Alert card. With Premium, you can choose a different threshold, from 3 to 10 hPa, and get a notification as well. A forecast fall is not a prediction that you will have an attack.
- Exports. With Premium, the CSV export includes the pressure at the start of each attack, and the JSON export also includes the 24-hour change.
- Your own suspicion, separately. Pressure Drop, Pressure Rise and Weather Change are also in the trigger list. They record what you suspected, while the saved reading records what was measured.
Sources
- Kimoto et al. Influence of barometric pressure in patients with migraine headache. Internal Medicine, 2011
- Okuma et al. Examination of fluctuations in atmospheric pressure related to migraine. SpringerPlus, 2015
- Katsuki et al. Investigating the effects of weather on headache occurrence using a smartphone application and artificial intelligence. Headache, 2023
- Portt et al. Weather, air pollution, and migraine: a case-time series analysis examining environmental exposures and transient health outcomes recorded via smartphone application. Environmental Epidemiology, 2026
- Prince et al. The effect of weather on headache. Headache, 2004
- Zebenholzer et al. Migraine and weather: a prospective diary-based analysis. Cephalalgia, 2011
- Mukamal et al. Weather and air pollution as triggers of severe headaches. Neurology, 2009
- Casanova et al. An observational study of self-reported migraine triggers and prospective evaluation of the relationships with occurrence of attacks enabled by a smartphone application. Headache, 2022
- Farah et al. Impact of barometric pressure changes on the severity, frequency, and duration of migraine attacks: a systematic review of the literature. Cureus, 2025
- US National Weather Service: Pressure definitions
- NOAA JetStream: Air pressure
- NIST Special Publication 811, Appendix B.8: conversion factors
- Apple WeatherKit: CurrentWeather.pressure
Sources checked on 8 October 2026. The worked example and app screens use fictional demonstration data.
App details checked against Migraine Tracker 1.0.9 on 8 October 2026. App screens and the worked example use fictional demonstration data. This post explains research and record keeping, not medical advice. The sources explain general principles and do not endorse Migraine Tracker.